
HPLC/UHPLC Technical Tip
Level: Intermediate
Tips for Successful Sample Loading in SEC
Size‑exclusion chromatography (SEC) follows a common set of operating principles that apply across a wide range of applications, from globular proteins to synthetic polymers. One of the fundamental considerations in any SEC method is the balance between injection volume and sample concentration, both of which have a direct impact on peak shape, resolution, and sensitivity.
Because SEC relies on physical size rather than chemical interaction, the influence of these parameters is often more pronounced than in other chromatographic modes.
SEC separation fundamentals
In SEC, analytes are separated strictly according to their hydrodynamic size. The mobile phase and sample diluent are selected to minimize interactions between the analyte and the stationary phase, allowing separation to occur solely through differential access to the pore structure. Larger molecules are excluded from more pores and elute earlier, while smaller molecules penetrate more of the pore volume and elute later.
Since there are no retention or focusing mechanisms involved, the analyte band entering the column largely determines the final peak shape.
Injection volume and band broadening
When a sample is injected into an SEC column, it enters as a finite band whose length is proportional to the injection volume. Unlike reversed‑phase or ion‑exchange chromatography, this band does not compress at the head of the column.
As separation proceeds, molecular diffusion further broadens the band (Figure 1). Because SEC offers no mechanism to counteract this spreading, excessive injection volume directly results in wider peaks and reduced resolution.
For optimal performance, injection volume should therefore be kept as small as practical.
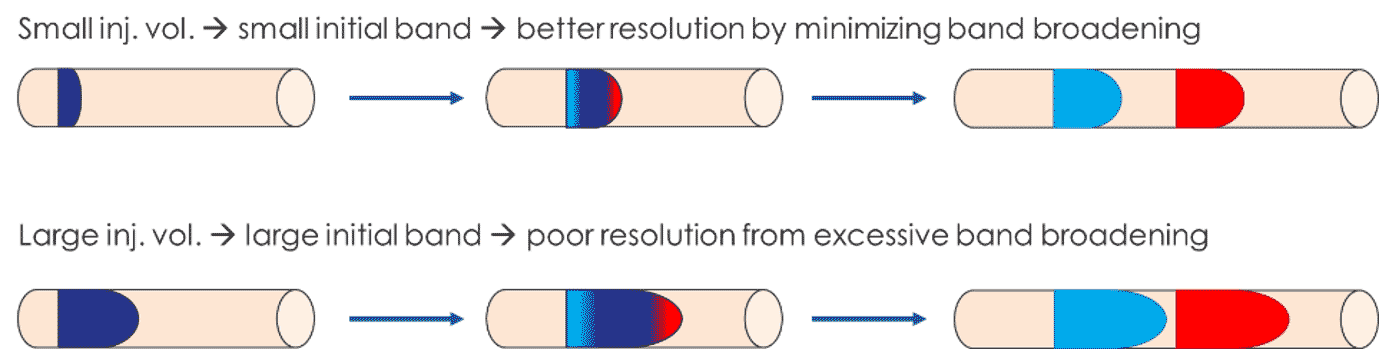
Figure 1 – Injection volume and band broadening: Increasing injection volume introduces band broadening in SEC, reducing resolution and compromising molecular weight accuracy.
Using sample concentration to maintain sensitivity
Reducing injection volume often leads to reduced detector response. A common strategy to recover sensitivity is to increase sample concentration; however, this approach introduces important limitations.
At elevated concentrations, viscosity differences between the sample solution and mobile phase can cause unstable flow patterns during injection. This phenomenon, known as Saffman–Taylor instability, can distort sample bands and degrade peak shape, as illustrated in Figure 2.
As a result, SEC methods must operate within a practical concentration range to avoid compromising chromatographic performance.
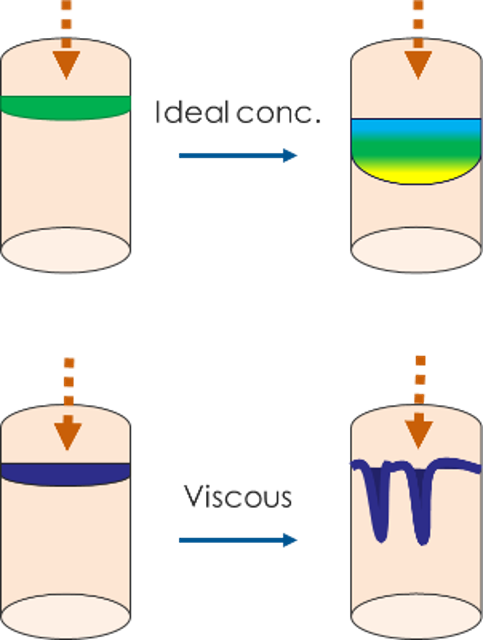
Figure 2 – Saffman-Taylor instability: High sample concentration can produce viscosity‑related flow distortion, leading to uneven band distribution and loss of peak symmetry.
Optimizing the balance
Successful SEC methods balance injection volume and sample concentration to achieve acceptable sensitivity without sacrificing resolution. Protein samples are generally more tolerant of higher concentrations, and concentrations in the range of 1–10 mg/mL often provide good results when paired with appropriately small injection volumes.
In most cases, reducing injection volume yields immediate improvements in peak shape, while sample concentration should be increased only to the extent necessary to meet detection requirements.
Key takeaway
Injection volume and sample concentration are interdependent parameters that play a critical role in SEC performance. Large injection volumes increase band broadening, while excessive sample concentrations can introduce viscosity‑related artifacts.
Optimizing these parameters allow analysts to improve SEC results without changing columns, mobile phases, or instrumentation.
We hope you found this tip useful. Check out our technical library for more chromatography tips and stay tuned for new tips next month!
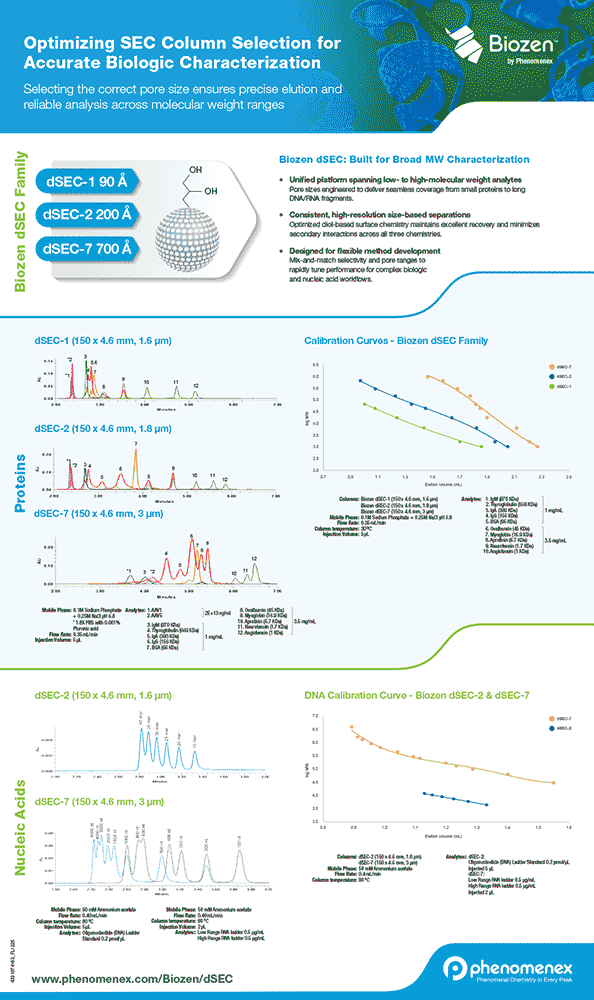
Optimizing SEC Column Selection for Accurate Biologic Characterization
Accurate SEC relies on selecting the appropriate pore size to ensure precise molecular weight characterization across diverse biomolecules. This flyer highlights comparative data generated using Biozen dSEC columns with 90 Å, 200 Å, and 700 Å pore sizes, demonstrating broad molecular weight coverage from proteins to long DNA and RNA fragments
Biozen dSEC-2 Application Guide
Use the Biozen dSEC-2 Application Guide for size exclusion chromatography of biologics, exclusively by Phenomenex.

Phenomenex, the P icon, and the Phenomenex product and service marks mentioned herein are trademarks or registered trademarks of Phenomenex, Inc. in the United States and/or other countries. All other trademarks are the property of their respective owners. One or more authors are affiliated with Phenomenex, Inc. FOR RESEARCH USE ONLY. Not for use in clinical diagnostic procedures. © 2026 Phenomenex, Inc. All rights reserved.

Phenomenex is a technology leader committed to developing novel analytical chemistry solutions that solve the separation and purification challenges of researchers worldwide.
CONNECT WITH US


