Sample Preparation Technical Tip
Level: Advanced
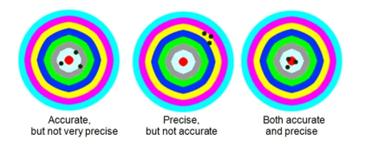
The Difference Between Precision and Accuracy in SPE
In the heart of every good chromatographer is a solid understanding of the most crucial vocabulary. For those practicing solid phase extraction, precision and accuracy are fundamental components to their craft. Precision and Accuracy refer to the robustness and reproducibility of an analytical method.
Precision
The precision of an analytical method is the closeness of a series of individual analyte measurements applied repeatedly to multiple aliquots of the same sample. It is usually calculated as a Relative Standard Deviation (RSD). The RSD is often tested in three different categories:
• Repeatability (intra-day (same day) precision)
• Intermediate precision (inter-day precision)
• Reproducibility (inter-laboratory precision)
Repeatability is often tested at three different concentrations – low, medium, and high. Acceptance criteria vary per analysis method, and according to the widely adopted guidelines of The International Council for Harmonisation of Technical Requirements for Pharmaceuticals for Human Use (ICH), they should be set fit for purpose1. In an example pharmaceutical QC method, precision should be better than two percent (i.e., RSD lower than 2%). Intermediate precision shows the variations affected in day-to-day analysis by different analysts, different instruments, and other related factors. Reproducibility, as used in these constraints, represents precision obtained between different laboratories.
Accuracy
The accuracy of an analytical method is the degree of closeness between the “true” value of analytes in the sample and the value determined by the method. Accuracy is often determined by measuring samples with known concentrations and comparing the measured values with the ”true” values. For example, before adopting the current ICH guidelines, the US Food and Drug Administration (FDA) mandated that accuracy be determined by a minimum of five measurements for at least three concentrations (low, medium, high) in the range of expected concentrations. The mean value for the higher concentrations was to be within 15 percent from the “true” value (i.e., 85% - 115% of the true value). The mean accuracy for the LLOQ (lowest concentration with, in this case, > 5:1 signal to noise ratio) was to be within 20 percent (80% - 120% of the “true” value).
Check out the linked resources below.
We hope you found this tip useful. Look out for more technical tips next month!
1. International Council for Harmonisation of Technical Requirements for Pharmaceuticals for Human Use. (2023). Guideline on Validation of Analytical Procedures (ICH Q2(R2)). Retrieved from https://database.ich.org/sites/default/files/ICH_Q2%28R2%29_Guideline_2023_1130_ErrorCorrection_2025.pdf

SPE Method Development Tool
This SPE Method Development Tool will recommend an extraction method for you in under 1 minute!
Sample Preparation Reference Manual & Users Guide
This manual provides analytical chemists with a practical bench-top guide to SPE, teaching the basic principles of SPE, and facilitating the process of choosing the proper sorbent, optimizing methods, and troubleshooting problems.
Phenomenex, the P icon, and the Phenomenex product and service marks mentioned herein are trademarks or registered trademarks of Phenomenex, Inc. in the United States and/or other countries. All other trademarks are the property of their respective owners. One or more authors are affiliated with Phenomenex, Inc. FOR RESEARCH USE ONLY. Not for use in clinical diagnostic procedures. © 2026 Phenomenex, Inc. All rights reserved.

Phenomenex is a technology leader committed to developing novel analytical chemistry solutions that solve the separation and purification challenges of researchers worldwide.
CONNECT WITH US